Order Fulfillment Dashboard
🧩 The Challenge
Trevo Logistics Solutions, a trusted name in nationwide delivery for over 20 years, faced a growing challenge: rising order backlogs were threatening customer satisfaction and operational efficiency.
With high demand and complex routing logistics, the company needed a smarter way to monitor fulfillment performance and reduce delays.
🎯 The Solution
I developed an interactive Excel dashboard that provides real-time visibility into Trevo's order fulfillment pipeline.
This tool empowers operations managers to track delays, optimize resource allocation, and proactively address bottlenecks—ultimately improving delivery speed and customer experience.
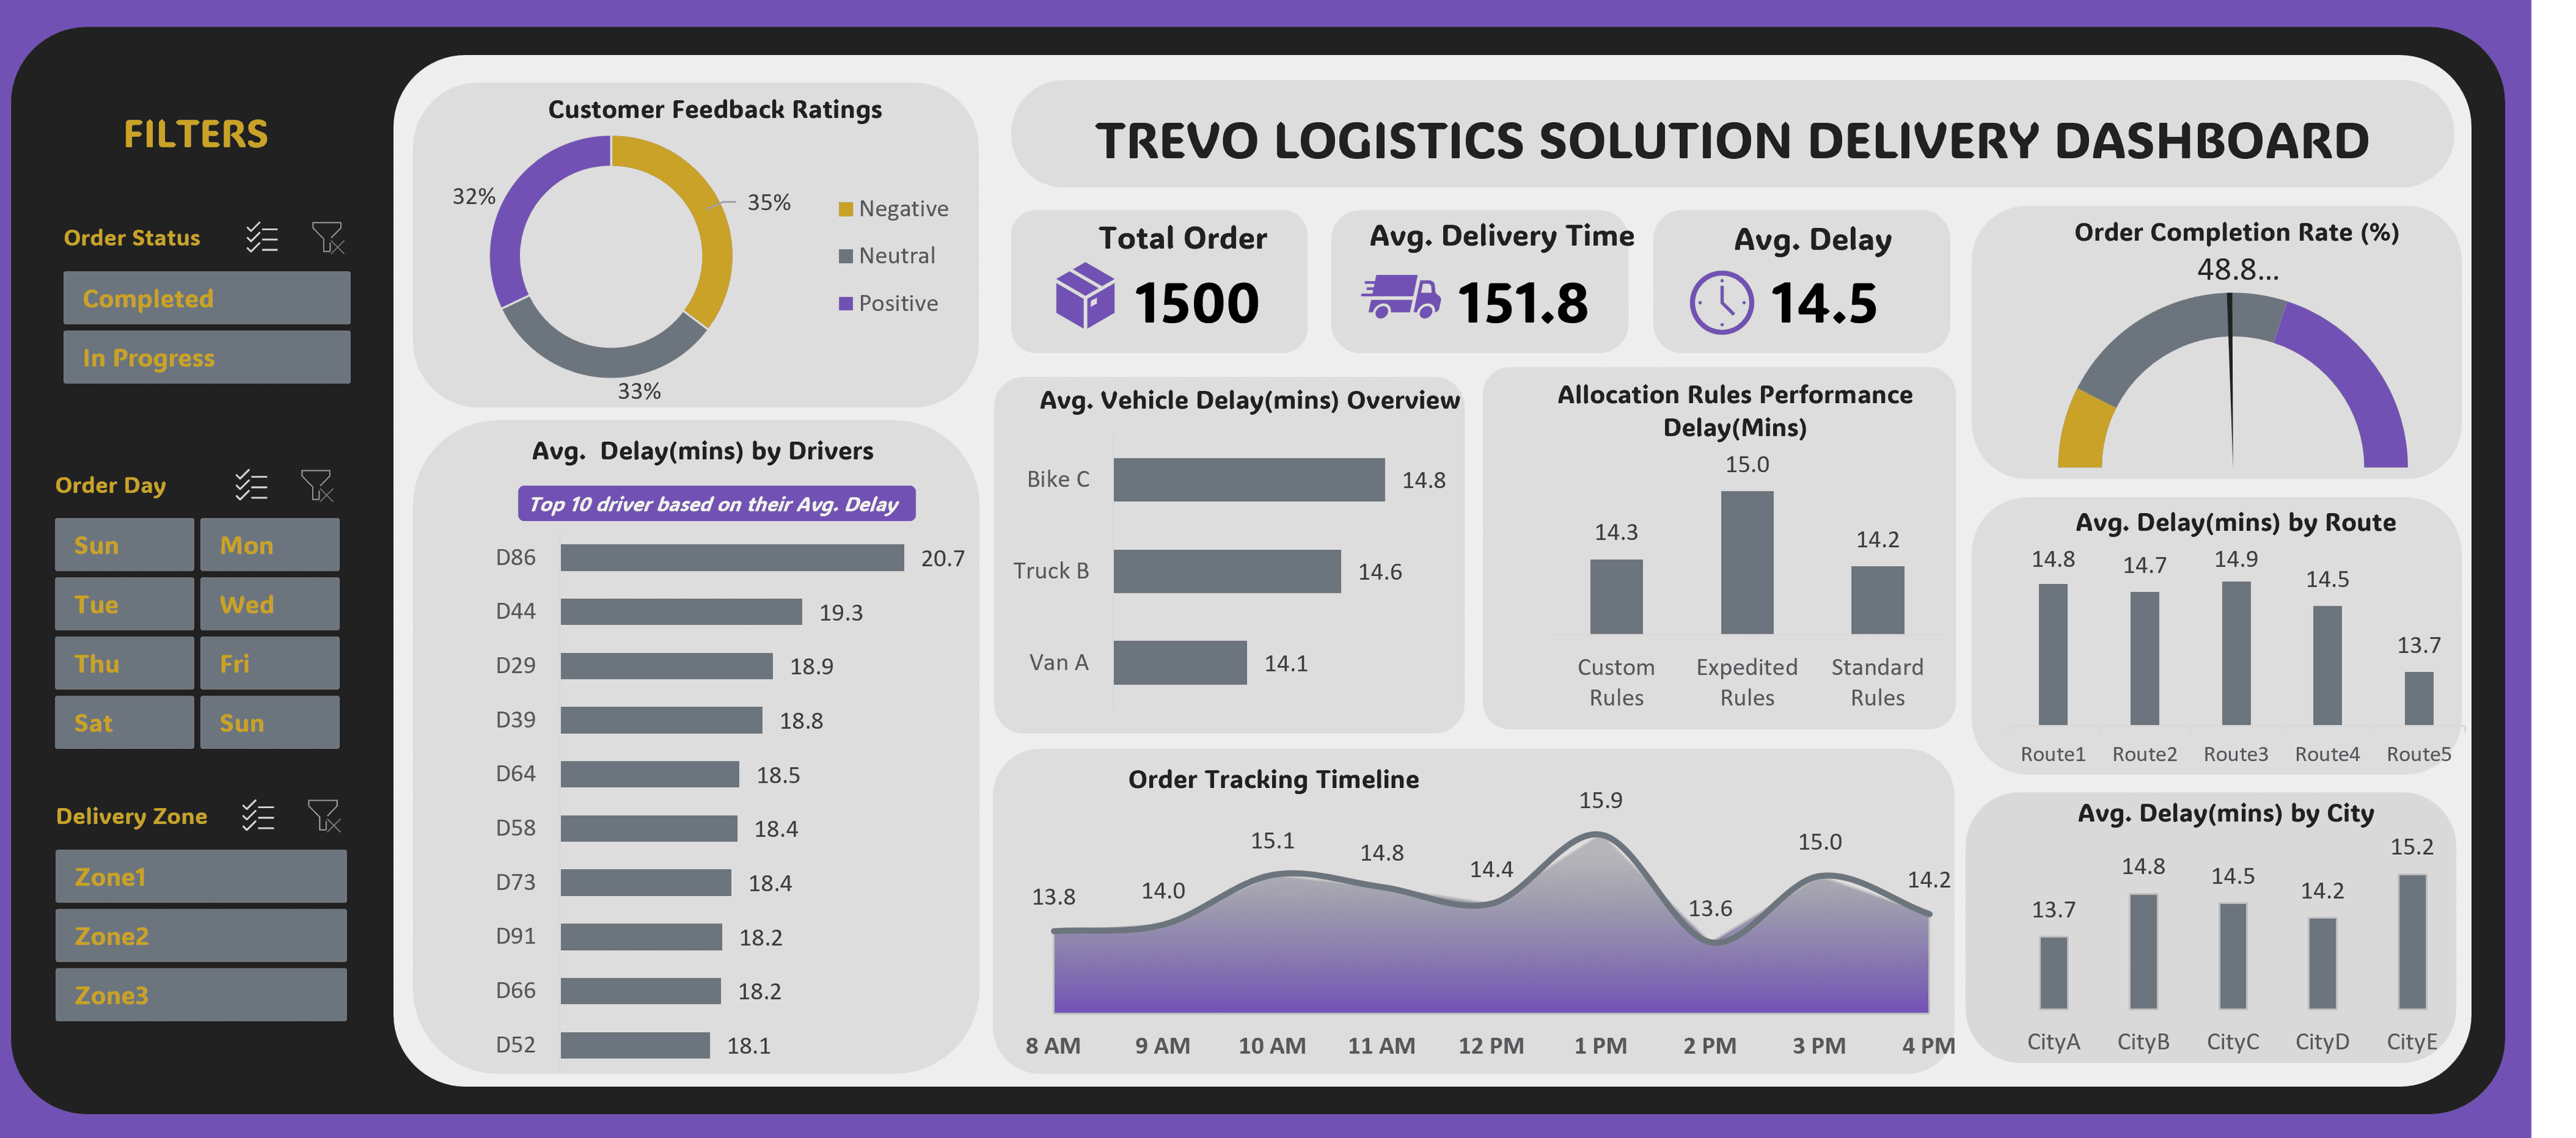
📦 Dashboard Highlights
- Order Status Overview: Visualized completed vs. backlogged orders to assess fulfillment health at a glance.
- Driver Delay Analysis: Ranked drivers by average delay to identify training or routing issues.
- Route Performance: Compared delays across delivery routes to uncover inefficiencies.
- Vehicle Delay Overview: Evaluated delay trends by vehicle type to inform fleet management.
- Allocation Rule Performance: Assessed how different vehicle allocation strategies impacted delivery speed.
- Customer Feedback Distribution: Displayed sentiment breakdown (positive, neutral, negative) to correlate delays with satisfaction.
- Order Timeline Tracking: Used Gantt-style visuals to monitor order progress and detect delivery bottlenecks.
- City-Level Delay Insights: Highlighted average delivery delays by city to guide regional improvements.
🧠 Design & Interactivity Features
- Dynamic Filtering: Users can filter by driver, route, vehicle type, and delivery city.
- Automated Updates: Integrated Power Query for seamless data refresh from backend systems.
- Responsive Visuals: Charts and timelines update instantly based on selected filters.
- User-Friendly Navigation: Designed with intuitive layout and tooltips for non-technical users.
💡 Impact
This dashboard became a central tool for Trevo's operations team, enabling faster decision-making and more precise resource deployment.
It helped reduce order backlogs, improve delivery timelines, and strengthen customer trust—reinforcing Trevo's reputation for reliability in the logistics industry.
The implementation delivered:
- Faster identification of bottlenecks in the delivery pipeline
- Improved driver accountability through performance tracking
- Better resource allocation across routes and vehicles
- Enhanced customer experience through reduced delays
- Data-driven decision making for operations managers
🛠 Tools & Technologies
Primary Tools: Microsoft Excel, Power Query
Key Techniques:
- Advanced formulas for dynamic calculations
- Power Query for automated data refresh
- Conditional formatting for visual alerts
- Interactive slicers for multi-dimensional filtering
- Custom charts and timeline visualizations
- DAX-style calculations for performance metrics
📊 Technical Approach
The dashboard was built with a focus on:
- Data Integration: Connected multiple data sources through Power Query
- Real-Time Updates: Automated refresh schedules for current data
- User Experience: Intuitive filters and clear visual hierarchy
- Performance Metrics: Custom KPIs aligned with business objectives
- Scalability: Architecture supporting growing order volumes